Introducing ... the bubble. It's just a circle that is supposed to represent something abstract that we know, only we think of it as a bubble because like many ideas it is fragile and may burst at any moment. If you draw bubbles on a page and attempt to show relationships among abstract (even partially baked) concepts, then you have a bubble diagram. Bubble diagrams give us the courage to create something from nothing, i.e. documentation that specifies abstract concepts that are incomplete, changing, and might even be wrong before we know it. If you are learning about bubble diagrams for the first time and think they are cool, then you might consider becoming a software engineer.
Bubble diagrams are a simple way to communicate among people of different backgrounds, and are easy to learn to read and understand. However there are many kinds of bubble diagrams. While they may all look similar, they can have drastically different meanings and purposes. With some practice, you can learn to tell them apart. We will use bubble diagrams to describe the algorithm for an artificial pancreas. These include context diagrams, state machines, and data flow diagrams.
As an example of these diagrams, let's consider the simplest kind of soda machine. If you put in a $1 coin (nothing else accepted), then it will let you choose between coke and diet coke (nothing else). That's it. Of course, it will not give you a beverage unless you pay first, and only cares what kind of beverage that the paying customer will select. Now read the descriptions of the diagrams below and look at this simple example.
The Context Diagram[]
The context diagram is easy to identify because it has a single bubble, usually a big one in the center of the diagram, which represents the boundaries of everything we are considering to know or define. The inside of the bubble is usually empty except for perhaps a name of the overall project. All of the things we need to touch or interface with will be shown outside of the bubble, usually with "terminators" or boxes which represent something tangible in the outside universe that we need to touch.
We can refer to everything in the bubble as "our system." All inputs to and outputs from the system are shown in the context diagram.
This diagram is intended to show the "context" of our project, and is often the first step in understanding the project. Is is usually the first page in a functional decomposition. All other pages of the functional decomposition will focus on the insides of the bubble, or the details of the obscure function we wish to capture.

The Data Flow Diagram[]
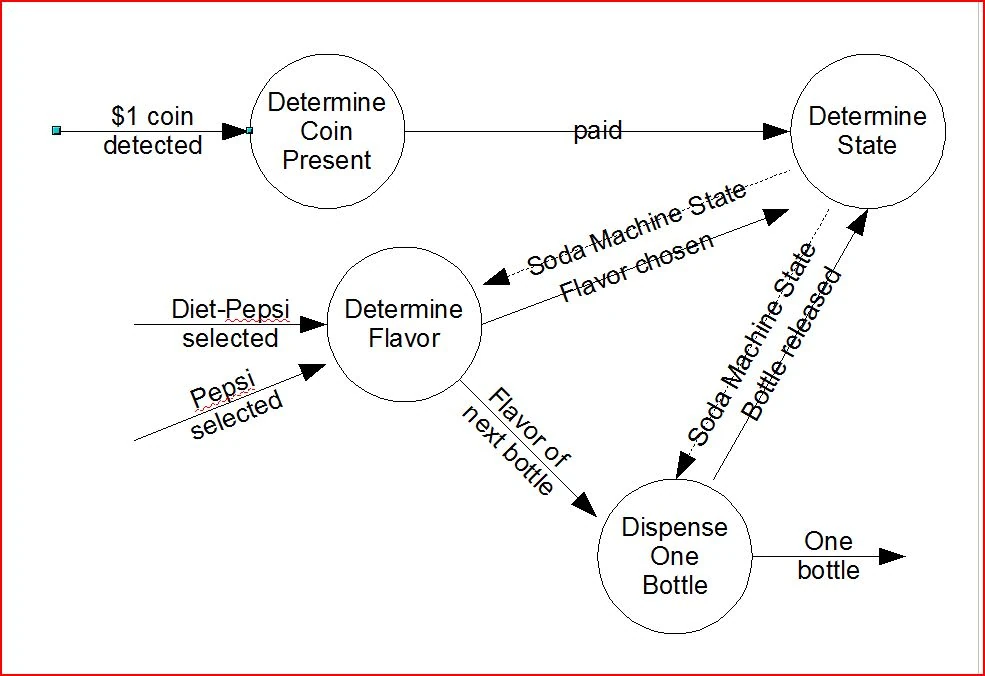
In a data flow diagram, each bubble represents a function or process. Arrows going into the bubble represents input data, and arrows coming out of the bubble represent output data. Typically an arrow is an output from one bubble and becomes an input to another bubble, and when this happens it is known as a "data flow." A data flow diagram shows many bubbles representing functions or processes, and arrows which show how the data moves among them. The arrows in a data flow diagram should therefore be named after the variables or data that is being passed, i.e, you would expect the name to be a description of what is being passed, as opposed to an event or action.
You could say the purpose of each bubble function is to create its output. Each input necessary in a function must come from some where, and that is either a terminator from the outside world that is captured in the context diagram, or else from another process. Furthermore, a data flow implies the order of execution in software (if software is used, which in our case it will be). You must execute a process first that creates the outputs that are needed as inputs for other processes, and only then run the dependent processes after its inputs are ready. Otherwise, there is no dependence on the processing sequence.
Each bubble in a data flow diagram can represent a final idea (whose details are complete and for which software will be created), or it can also be decomposed from a "parent" bubble into another "child" data flow diagram consisting of more bubbles. When this happens, the bubble diagrams are "nested." Dangling inputs to a bubble must come from the higher nested bubble, and dangling outputs from a bubble go back up to the higher nested bubble. The ability to decompose abstract ideas of very complex systems into manageable concepts that are further nested/decomposed is a helpful tool to manage a complex design. Without that, we would have to deal with a long list of details that would read like more like a text book and less like a list of ideas that each are little understandable nuggets of techie goodness.
As always is the case of a functional decomposition, names are selected to help clarify. The names in the bubbles should hint at their jobs, and the name of each data flow should hint at the information flowing.
The State Machine[]
Bubbles in the state machine are quite different from the other bubbles we talked about so far: in a state machine diagram, each bubble is a "state" or "mode." The state machine shows a sequence of events, and the logic needed to transition through the sequence, and hints at the functions to be performed throughout the sequence. Each bubble, or state, is a unique place in the sequence of events, and depending on events it shows where you can be at any time in the sequence -- and obviously you cannot be in two states at the same time. You will always be in the present state, having come from a past state, and ready to go to a future state.
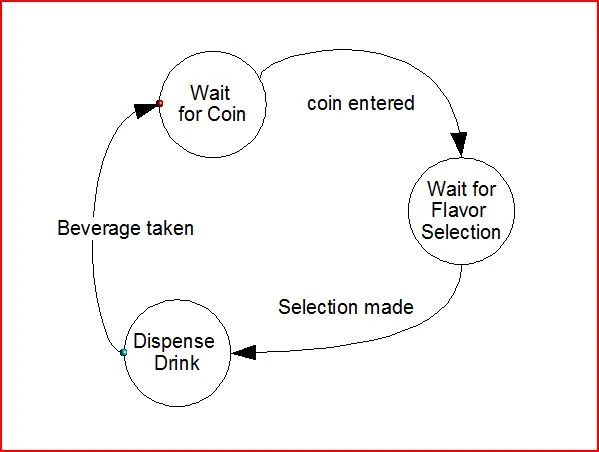
State machines are a fun way to show the behavior of logic. There are other ways to describe logic: Boolean equations, truth tables, combinational logic where all possible combinations of inputs can be matched with the expected output for that case -- but the sequence of events is not important. Sometimes however the sequence of events is vital to the operation of logic, and that is when the state machine is needed to define the sequence. Consider a soda machine which sells a choice of drinks for a $1 coin. The sequence we want is first to enter the dollar, second to select the flavor of beverage, and last to dispense the drink, after which the state machine waits for the next customer to enter a coin. It would be poor design to dispense the drink before it was paid for or before the flavor was selected. It is also unhelpful to allow a customer to select the flavor before paying.
The state machine documents the conditions that must occur to allow the transition from one state to another state. The arrows between the bubble states are state transitions, and they document the conditions upon which the transition is expected. Transitions are events, their names imply action, and represent the conditions for the event to occur. In our simple beverage machine above, we might change states when a coin is entered and so might name that transition "coin entered." The name of the old state might be "wait for coin" and the new state "wait for flavor selection."
A state machine is often a cycle, i.e. the last state goes back to the first state. That fact also makes the state machine easier to recognize. Otherwise it can be difficult to recognize a bubble diagram as a state machine if its creator does not use the words "state" or "mode" to make this clear.